Most exhibitors miscalculate trade show ROI by 2–4× because they ignore loaded costs and long sales cycles. Here's the formula that survives a CFO review — plus 6 metrics that predict revenue, a calculator, and a 12-month measurement window.
Most exhibitors think they're calculating trade show ROI — but they're not. They count badge scans, divide by booth fees, and call it done. Their CFO nods politely. Then next year's budget meeting arrives and nobody can explain why a $50,000 booth is back on the line item. (If you'd rather skip straight to the math, our trade show ROI calculator runs the model in 60 seconds.)
The problem isn't trade shows. The problem is the math.
The lead-count-divided-by-booth-fee model under-counts your real investment, over-counts your "revenue," and ignores the 84-day B2B sales cycle entirely. (Bizzabo)
This guide gives you the framework that survives a CFO review: the trade show ROI formula done properly, a true cost equation, the six exhibition ROI metrics that actually predict revenue, a calculator you can copy into a spreadsheet today, and a 12-month measurement window that captures the full payback — not just the post-show sugar high. If you'd rather skip the build, our trade show ROI calculator runs the same model in 60 seconds.
Trade show ROI, defined: Trade show ROI is the return generated from exhibiting at an event, calculated by comparing total revenue (or qualified pipeline value) against the fully loaded cost of participation — booth, staff time, travel, marketing, tech, and post-show follow-up — over a 12-month measurement window.
Most companies miscalculate this by 2–4× because they ignore fully loaded costs and long sales cycles. Get either input wrong and the output isn't ROI — it's fiction.
In short
The textbook trade show ROI formula is simple:
┌──────────────────────────────────────────────────────────────┐
│                                                              │
│            TRADE SHOW ROI FORMULA                            │
│                                                              │
│   ROI (%) = (Revenue − Total Investment)                     │
│             ─────────────────────────────  ×  100            │
│                  Total Investment                            │
│                                                              │
└──────────────────────────────────────────────────────────────┘
Spend $50,000 on a show, generate $200,000 in attributable revenue, and your ROI is 300%. (Joor)
That's clean enough to put in a slide, and clean enough to be wrong in two predictable ways.
It under-counts the investment. Most teams plug in the booth invoice and stop. Booth rental is typically only 25–30% of true event spend once you load in design and build, drayage, travel, lodging, staff salaries-for-days-worked, pre-show marketing, on-booth tech, giveaways, and post-show follow-up labor. (Cvent)
It over-counts the revenue. "Revenue from leads we captured there" is rarely a clean number. B2B deals average 84 days to close; enterprise deals run 6–12 months. (ExecViva) If you book the show in March and report ROI in April, you're reporting on a sales cycle that hasn't run yet. You're also ignoring the influenced revenue — open opportunities that touched the booth but were already in pipeline.
The formula isn't broken. The inputs are.
Build your investment line by line. From the cost stacks we see across the thousands of B2B trade shows listed on TradeShowBuzz, a defensible breakdown for a single mid-sized show looks like this:
| Cost category | Typical share | Visual |
|---|---|---|
| Booth space + design/build | 25–30% | ████████████ |
| Staff time (salaries × days, travel days included) | 15–25% | ██████████ |
| Travel, lodging, per diem (4–8 staff) | 15–20% | ████████ |
| Shipping + drayage | 8–12% | █████ |
| Pre-show marketing + sponsorship adds | 5–10% | ████ |
| Post-show follow-up labor (SDR hours, nurture) | 5–10% | ████ |
| On-booth tech (lead capture, demos, screens) | 3–7% | ███ |
| Giveaways + collateral | 2–5% | ██ |
Two cost lines that almost always get missed: staff time and post-show follow-up labor. Send four people for four days at a fully-loaded cost of $700/day and that's $11,200 — often more than the booth design budget — and it doesn't appear on any invoice. Skip it and your ROI math flatters itself by 20–40%.
Worked example. A booth invoice of $18,000 looks like $18,000 of investment. Loaded properly:
True investment: ~$60,700 — 3.4× the booth invoice. Run your ROI on $18K and the number won't survive the second slide of a CFO review.
A pattern we see repeatedly. Picture a mid-market SaaS team exhibiting at a regional expo. They walk away with 180 leads — a number the VP of Marketing posts in the team Slack the same night. Three months later, those 180 leads have produced 3 qualified opportunities and one closed deal worth $22K. Against a loaded cost of ~$48K, ROI is negative. The next event, they cut two staff, kill the swag table, double pre-show outreach, and train booth staff to disqualify aggressively. They scan fewer leads — 92 — but generate 11 qualified opportunities and 4 closed deals worth $146K. Same booth size. 5× the pipeline. The headline metric (lead count) had been telling them the opposite of the truth.
These four numbers feel like progress and predict almost nothing:
The pattern: each one rewards activity, not intent. Industry analysts have made the same point for years — relying on footfall and badge scans means missing the value the event actually delivered. (Wave Connect) Track them as diagnostics if you want — a falling scan count tells you something about positioning — but don't put them in the headline ROI number. The headline number has to be revenue or a leading indicator of revenue.
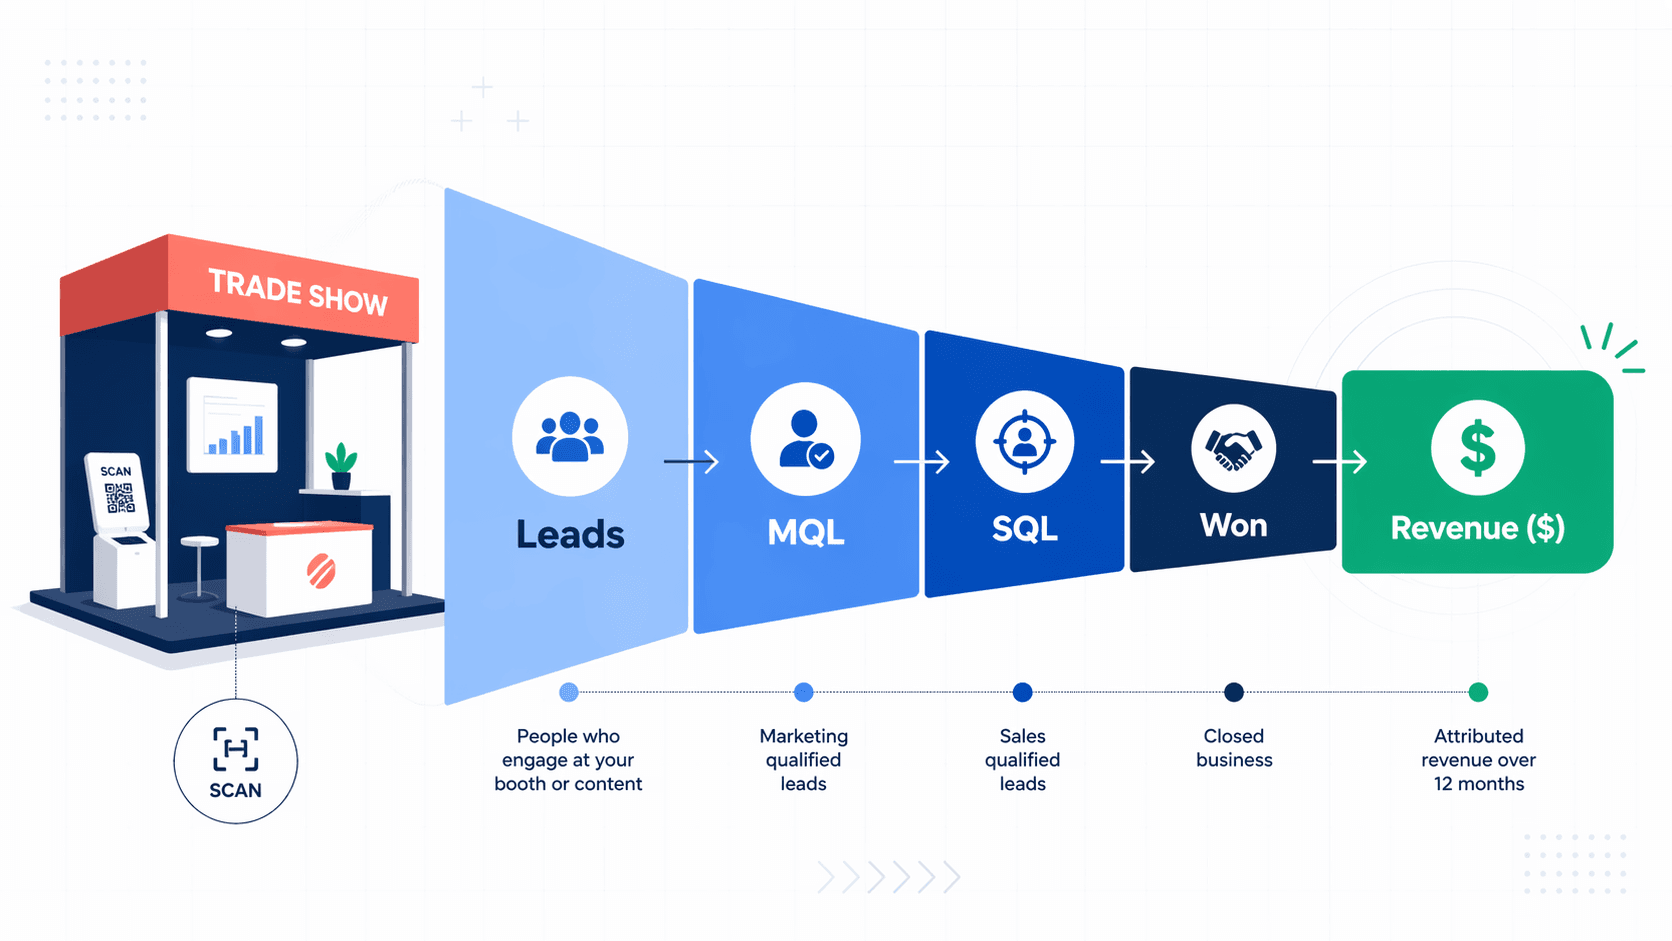
Replace the vanity stack with these. Looking across the thousands of B2B trade shows tracked on TradeShowBuzz, the exhibitors who renew booths year after year almost always measure these six — the ones who churn off the floor almost always don't. Each one has a documented relationship to closed-won. The funnel they collectively measure looks like this:
Booth Visitors  →  Leads  →  MQL  →  SQL  →  Closed-Won  →  LTV-Adjusted Revenue
   (vanity)      (volume)   (intent)  (fit)   (outcome)        (real ROI)
The vanity metrics live at the left edge. Real ROI lives at the right edge. The metrics below tell you whether revenue is actually moving from one to the other.
Not lead count. Dollar value of opportunities created with a stage and an ACV attached. A trade show that produces 200 scans and 4 opps worth $80K each ($320K pipeline) outperforms one with 800 scans and 6 opps worth $20K each ($120K pipeline) — every time, regardless of which booth was busier.
Tag every lead with an event source field in your CRM and watch the funnel separately. If your trade-show MQLs convert to SQLs at 40% but your inbound MQLs convert at 18%, the show is producing higher-intent leads even when the raw count is smaller. The reverse pattern — high lead volume, low SQL rate — means you're attracting the wrong audience or your booth qualifies poorly.
Open opportunities whose contacts attended the booth or a session, even if they didn't originate at the event. In long sales cycles, a 30-minute booth conversation with an existing buying-committee member is often the deal-mover. Marketing ops teams that report only sourced revenue undercount event impact by a wide margin. (UnboundB2B)
The strongest near-term intent signal you can capture. A scheduled 30-minute meeting with a named buyer beats 50 cold scans on every conversion benchmark. Track meetings booked onsite separately from total scans, and report both — the ratio is a quality score for your booth staffing.
Leads contacted within 2 hours of a badge scan convert at roughly 4× the rate of leads contacted 24+ hours later. (Joor) This is the single highest-leverage operational metric on this list. If your show generates 300 leads and your SDR team takes five days to start working them, you've thrown away most of the revenue before you began.
Trade-show-acquired customers tend to carry roughly 40% higher lifetime value than other-channel customers in B2B benchmarks. (Wave Connect) The face-to-face origination correlates with stickier accounts. Measure ROI on first-deal ACV alone and you systematically undervalue the channel.
Two supporting data points worth knowing for the conversation with your CFO: 33% of annual new business comes from trade shows for B2B exhibitors who measure it, and attendees are 72% more likely to buy from exhibitors they've met in person. (Wave Connect) The face-to-face channel is unusually efficient on conversion — it's the cost side that needs the discipline.
Key takeaway
- Booth invoice is only 25–30% of true investment.
- Lead count ≠ revenue. Qualified pipeline created ($) is the real KPI.
- Speed-to-lead matters more than scan count — <2 hr follow-up converts ~4× higher.
- Event-sourced customers carry ~40% higher LTV than other channels.
- Measure on a 12-month window, not the Monday after the show.
Here's the model. Copy it into a spreadsheet today — or skip the build and use the version we already wired up: the TradeShowBuzz ROI calculator runs the same math with a CFO-ready output.
Inputs:
I) — the loaded cost stack from earlierL)m) — % of leads that qualify as marketing-qualifieds) — % of MQLs that become sales-qualifiedw) — % of SQLs that closeACV)LTV_x) — typically 2.5–4× ACV for B2B SaaS, lower for transactionalFormula:
First-deal Revenue   = L × m × s × w × ACV
LTV-adjusted Revenue = First-deal Revenue × LTV_x
ROI %                = (Revenue − I) ÷ I × 100
Payback (months)     = I ÷ (Revenue ÷ sales_cycle_months)
Worked example with the $60,700 show from earlier:
| Output | Calculation | Result |
|---|---|---|
| First-deal revenue | 220 × 0.35 × 0.50 × 0.25 × $24,000 | $231,000 |
| LTV-adjusted revenue | $231,000 × 3 | $693,000 |
| First-deal ROI | ($231,000 − $60,700) ÷ $60,700 | 281% |
| LTV-adjusted ROI | ($693,000 − $60,700) ÷ $60,700 | 1,042% |
| Payback (6-month cycle) | $60,700 ÷ ($231,000 ÷ 6) | 1.6 months |
Run the same model with the booth-invoice-only investment ($18,000) and you'd report 1,183% first-deal ROI — a number that's structurally inflated and won't hold up when finance audits it.
Try this with your own numbers → trade show ROI calculator. Loaded cost stack, conversion funnel, payback window — all in one screen.
Benchmark to anchor against: healthy trade show ROI lands in the 300–500% range over 12 months for well-measured B2B programs, with a 4:1 revenue-to-spend ratio as the floor for "worth doing again." (Joor, Cvent) If your model returns 1,000%+, double-check your inputs before you celebrate.
A note on cost-per-lead benchmarks. Headline industry data puts trade-show CPL anywhere from $112 to $811 depending on the report and how loaded the cost stack is. (AxZ Lead) That spread is itself a data point: most published CPL numbers under-count investment, so direct comparison to other channels is usually unfair to events. A face-to-face meeting at a trade show costs roughly $142 vs. $250 at the prospect's office — the per-meeting math favors events even before pipeline conversion. (Wave Connect)
ROI on Monday after the show is meaningless. Measure on a cadence:
| Checkpoint | What to report |
|---|---|
| Day 7 | Leads captured, % contacted within 48 hrs, meetings booked onsite, scan-to-MQL conversion |
| Day 30 | MQLs accepted, SQLs created, opportunity dollar value created |
| Day 60 | SQL → opportunity conversion, influenced pipeline updated |
| Day 90 | First closed-won deals, win rate vs. baseline, payback progress |
| Day 180 | Pipeline maturity, mid-cycle deal velocity |
| Day 365 | Final sourced + influenced revenue, LTV-adjusted ROI, decision input for next year |
The 12-month window is non-negotiable for enterprise programs. Reporting earlier is fine — just label it as an interim number, not the final ROI. The two most common ways exhibitors lose internal funding for events: (a) they report a flattering 30-day number that the 365-day number underperforms, or (b) they report nothing at all because the cycle hasn't closed.
The mistakes that consistently sink trade show ROI:
For deeper coverage on the operational side — booth setup, lead capture workflows, and post-show follow-up cadences — see our exhibitor guides and trade show best practices library.
Copy this into your project doc 30 days before the show:
Use the calculator before booking. The single most expensive moment in a trade show program is the renewal-pricing email from the show organizer in Q4. Run the model on last year's actuals. If the answer is below your 4:1 floor, the conversation isn't "how do we get more leads next year" — it's "should we be at this show at all."
Teams that track this consistently usually outgrow the spreadsheet. The first event ROI calculation lives in Excel; the second lives in a shared sheet; by the fifth event it's a CRM dashboard or a dedicated event-ROI system. The math doesn't change — only how many people can read it without breaking it. Wherever you are on that path, the formula above is the one that holds up.
That's the math. Most exhibitors don't do it because the booth-invoice-divided-by-scans version is faster. The trade-off is that the fast version doesn't survive a CFO review and doesn't tell you whether to come back. The framework above does both.
Calculate your next show's ROI in 60 seconds → TradeShowBuzz ROI calculator. Loaded costs, full funnel, payback window, benchmark comparison — built on the formula in this guide.
A healthy trade show ROI lands in the 300–500% range over 12 months for well-measured B2B programs. The industry-accepted floor is a 4:1 revenue-to-spend ratio — anything below that and the show is unlikely to be worth re-booking. Numbers above 1,000% almost always mean the investment side has been under-counted (usually by leaving out staff time and post-show follow-up labor).
Use the formula ROI % = (Revenue − Total Investment) ÷ Total Investment × 100, but with two adjustments most exhibitors skip. (1) Total investment must include booth, build, shipping, travel, staff time, pre-show marketing, on-booth tech, giveaways, and post-show follow-up — typically 3–4× the booth invoice. (2) Revenue must include LTV-adjusted closed-won deals plus influenced pipeline, measured on a 30/60/90/180/365-day cadence. Or skip the math and use a trade show ROI calculator that runs the model for you.
Six metrics predict revenue: qualified pipeline created (in dollars, not lead count), MQL→SQL→Won conversion rates by event source, influenced revenue, meetings booked onsite, speed-to-lead (lead-to-first-contact time), and event-sourced customer LTV. Vanity metrics — badge scans, booth traffic, swag distributed, social impressions — should be tracked as diagnostics only, never reported as ROI.
The full measurement window is 12 months because B2B deals average 84 days to close and enterprise deals run 6–12 months. Report interim numbers at day 7, 30, 60, 90, and 180 — but label them as interim. The 365-day number is the only one you should use to decide whether to renew the booth.
Headline industry data puts trade-show CPL between $112 and $811 depending on the report and how loaded the cost stack is. Across the thousands of B2B trade shows tracked on TradeShowBuzz, that spread reflects measurement inconsistency more than show quality — most published CPL numbers under-count investment. The more useful benchmark is per-meeting cost: a face-to-face meeting at a trade show runs about $142 vs. $250 at the prospect's office, so the per-meeting math favors events even before pipeline conversion.
Short answer: it depends — digital wins on cost, trade shows win on conversion quality.
On raw cost-per-lead, digital usually wins — paid search and social can deliver leads at $50–150 versus $112–811 for trade shows. But on conversion quality, trade shows typically lead: event-sourced leads convert to SQLs at higher rates, close at higher win rates, and produce customers with roughly 40% higher lifetime value. (Wave Connect) The right comparison isn't CPL — it's revenue-per-dollar-spent over a 12-month window. Run both channels through the same loaded-cost, LTV-adjusted formula and compare the outputs. For most B2B teams, the answer is "both, but for different stages of the funnel."
Lead with the loaded cost stack (not the booth invoice), the LTV-adjusted revenue (not first-deal only), and the influenced pipeline (not just sourced). Compare event-sourced win rate to your channel baseline. Show the 365-day number, not the 30-day. And bring the calculator with the inputs traceable to your CRM — finance teams trust models they can audit.